Staying on top of reimbursement is key to any group’s success in the revenue cycle management world, and if you’ve ever experienced a decrease in your reimbursement, you know that identifying the root cause can feel like searching for a needle in the haystack.
Focusing on these three methods of analysis will help you efficiently organize your review and identify your reimbursement issue quickly so you can spend your valuable time correcting the problem rather than searching for it!
- Historical Volumes – The first place to start your analysis is to review how your group is performing compared to previous periods. Are billing volumes and reimbursement totals lower in recent periods than they have been historically? Looking at these figures in comparison to historical averages at a total group level is important, but to find the root cause you will need to dig a little deeper. Ask the question “what is driving the change in volumes?” Reviewing these figures by provider, location, and payor levels will help you answer that question.
Historical Volumes by Provider: Have any providers left or changed their schedules, leading to lower billing volumes as a group? If a provider is showing a decrease in their average historical production, this a good perspective to review and attempt to identify a collection issue.
Historical Volumes by Location: Have there been any location changes? If your group provides services at multiple locations, it is beneficial to see the historical billing volumes and reimbursement figures by location to identify any dips that could have caused a decrease in reimbursement.
Historical Volumes by Payor: If recent collection totals have decreased, but billing volumes have remained consistent, it may be time for a more extensive review at the payor level. Has your payor mix changed over time? Has your collection percentage significantly decreased for a specific payor or class of payors? Reviewing denial trends and high-volume claim issues for your major payors is an important check point in your analysis.
Note, reviewing unit volumes of services may be a more efficient way to compare historical periods than reviewing the charge dollar amounts. A change in charge dollars (compared to a historical period) may be due to a change in fee schedule amounts and not an actual change in the service volume. While performing unit volume analysis, it is important to review differences in historical evaluation & management (E&M) totals versus procedure totals. There could be a change in service mix, and a higher-than-normal volume of lower-reimbursed services could be the cause of a low payment period.
- Payment Lag – A very important factor in a group’s collections is timing. It is crucial to identify, on an individual payor basis, when that payor is reimbursing at a significantly slower rate than normal. The best way to review this is by breaking out your monthly payments by the period those services were billed. To do this, calculate the percentage of current period payments that came from the current charge period, then the percentage of payment from the previous charge period, and so on and so forth. This will give you a direct comparison period-over-period of when your payments are being received. The majority of a group’s collections come from the current and most recent billing period, as the preceding months account for a much smaller percentage of the total. Below is an example of how to look at your collections by month to determine if you are behind on your payments.
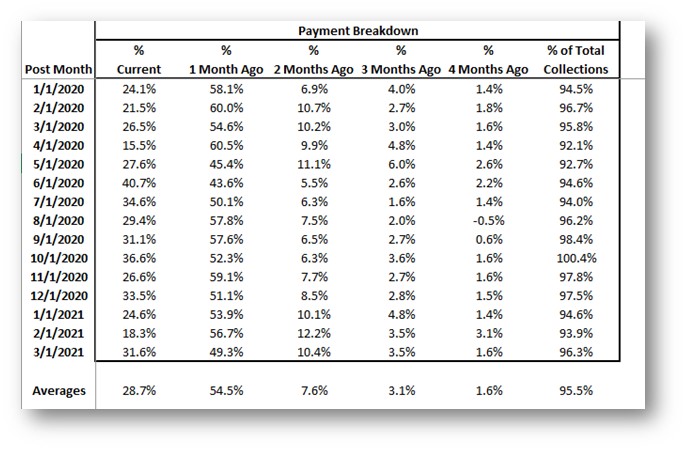
You can see by this report that almost all of this group’s collections (approximately 96%) are collected within 4 months of service date and that a majority of those collections (approximately 90%) are collected within 2 months of service date.
One thing to remember if reviewing reimbursement at the beginning of the calendar year is that most patient deductibles will not have been met, and many balances remaining are likely due from the patient. Since collecting payments from patients is typically a longer process than collecting from payors, this can cause a lag in reimbursement. Compare your January and February reimbursement of the current year to the January and February of previous years to see if there is a significant difference in reimbursement percentages. Be mindful of your fee schedule activity, as annual updates to your fee schedule need to be taken into account when comparing year-over-year.
- Fee Schedule & Contracted Rates – The third focus area for your reimbursement analysis is fee schedule and contracted rates. Make sure to review if there are any procedure codes being reimbursed at or above their billed amounts. Certain payors will only pay a maximum of the billed amount, so if their contracted rate is higher than what is being billed, your group could be cutting off revenue just by simply charging too low of a fee. Annual fee schedule reviews are encouraged to stay on top of the amounts being sent out to payors. As a baseline, many groups set their fee schedule at about 200-250% of the CMS Fee Schedule, but the biggest key is to take your own payor contracted rates into consideration and make sure your fee schedule is set appropriately for your group.
Starting with your highest volume payors, review the highest volume procedure codes billed and compare the rate of reimbursement for each code to your contracted amounts from those specific payors. Obviously, there can be thousands of procedures and services billed for, so to keep your review as efficient as possible, start with the top five to ten procedure codes and review the most recent reimbursement of each code to ensure your services are being reimbursed appropriately. Also make sure to compare the recent reimbursement rates for these codes to the rates received in previous periods to identify any changes over time from these payors.
There are many factors that could lead to decreased reimbursement, and the review can be daunting. Low reimbursement not only leads to cash issues but also increases a group’s Accounts Receivable, which accumulates more issues for the group or practice.
Focusing on your highest volume payors, locations, services, and providers using the analysis methods we’ve outlined is a great way to start your review and correct your revenue cycle issues, ultimately allowing you to operate at an efficient and profitable level.
This article and the information it includes is for educational purposes only. If you have any specific questions or concerns about collection analysis as it relates to your group or system’s reimbursement, please reach out to Anthony Morino at amorino@medicmgmt.com.
Anthony Morino is a Consultant – Analytics with Medic Management Group, LLC. In that capacity, he supports both health system and independent practice clients in the generation of actionable data, execution of initiatives based on business analysis, compliance, and reporting. Anthony’s background includes extensive work in areas including data analytics, revenue cycle assessment and execution, information technology solutions, compensation and business asset valuations, patient satisfaction and quality, and business improvement initiatives.